BLOG
BLOG
Pairing Data Center Design Tiers and Service Layers Drives Success
In the mission critical industry, site infrastructure tier standards are often viewed as the North Star of data center uptime. And while maintenance and UPS system service also play a critical role in reliability, the synergy between data center design and service is not often discussed.
To offer a fresh perspective on maximizing data center performance, we identify four layers of services and demonstrate how – when paired with a data center tier level – they can create a spectrum of options customizable to your uptime requirements.
The combination of service layer and data center tier level are examined through the key frameworks of availability, efficiency, total cost, and deployment.
By examining these elements and the trade-offs they present, we aim to provide a comprehensive framework for analyzing and balancing key data center success factors.
Data Center Design Standards
In the mid-1990s, the Uptime Institute developed a Tier Standard and Tier Classification System.
What once started as industry terminology has become the global standard for data center performance management and operational plans.
The data center classification system outlines four distinct tiers that represent data center redundancy from Tier I (Basic Capacity) up to Tier IV (Fault Tolerant).
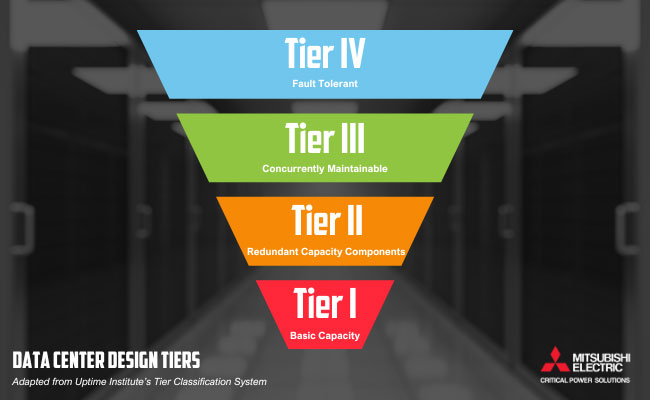
Here’s a deeper dive into the different characteristics of each data center tier:
|
TIER I |
TIER II |
TIER III |
TIER IV | |
|
Minimum Capacity Components to Support the IT Load |
N | N+1 | N+1 |
N After any failure |
|
Distribution Paths – Electrical Power Backbone |
1 | 1 |
1 Active 1 Alternate |
2 Simultaneously Active |
|
Critical Power Distribution |
1 | 1 |
2 Simultaneously Active |
2 Simultaneously Active |
|
Concurrently Maintainable |
No | No | Yes | Yes |
|
Fault Tolerance |
No | No | No | Yes |
|
Compartmentalization |
No | No | No | Yes |
|
Continuous Cooling |
No | No | No | Yes |
Source: Data Center Site Infrastructure Tier Standard: Topology (Uptime Institute, page 9, 2018)
Data Center Service Layers
Regularly scheduled UPS system maintenance is a key part of minimizing downtime. But there is a spectrum of support a service provider offers that truly defines the difference between minimizing downtime and maximizing data center uptime.
The level of responsiveness, consistency, quality, expertise, and lifecycle support create an array of service options that – when paired with a design tier – can significantly boost uptime.
Ranging from supporting the lowest redundancy to the highest uptime needs, the four data center service layers are L1, L2, L3, and L4.
|
LAYER 1 |
LAYER 2 |
LAYER 3 |
LAYER 4 | |
|
Maintenance Frequency Plan |
Sporadic |
Annual Minimum |
Semi-Annual Minimum |
Semi-Annual Minimum |
| Service Provider Specialization | Generic Techs | Generic Techs | Manufacturer Techs | Manufacturer Techs |
| Service Contract Agreement | None | 8-Hour Response | 8-Hour Response | 4-Hour Response |
| Software Upgrades | None | Sporadic |
Inherent with Direct SP |
Inherent with Direct SP |
| Field Change Notifications |
Best Effort by Mfg |
Best Effort by Mfg |
Inherent with Direct SP |
Inherent with Direct SP |
|
Compatibility Assurance (repairs & upgrades) |
None | Random or Sporadic |
Inherent with Direct SP |
Inherent with Direct SP |
| Day One Familiarity | None | None |
SP Started Equipment |
SP Started Equipment |
|
Direct Access to Engineering Support |
None | None |
Inherent with Direct SP |
Inherent with Direct SP |
| Emergency & Remedial Work | None | Outside of Contract |
Agreed Rates Quote Required |
Inherent with Service Contract |
|
Spare Parts Support |
Reactive & Ad-Hoc |
Basic Across Limited Fleet |
Complete Across National Fleet & Lifecycle |
Complete Across National Fleet & Lifecycle |
SP = Service Provider
Service Layer 1 (L1)
L1 is a self-maintained and reactionary state due to a lack of routine data center service. There is no, or very sporadic, maintenance on your system, leading to unmanaged risk.
Relying solely on equipment reliability puts your business in a reactive state leading to a higher risk and cost of downtime.
Service Layer 2 (L2)
Adding regularly scheduled annual UPS system maintenance slightly decreases your vulnerabilities as you reach the L2 layer.
With consistent, independent service, you are no longer solely relying on equipment reliability but still significantly lack the partnership, expertise, and contract to be proactive and cost effective.
Service Layer 3 (L3)
Partnering with the equipment manufacturer on data center service reaches L3: comprehensive support and high performance.
While a master-level service agreement hasn’t been reached, significant manufacturer resources are more readily available. Many facilities find themselves in the middle ground (L2 and L3).
Service Layer 4 (L4)
At L4 data center service, you reach maximum critical infrastructure protection.
A master-level service agreement and a true partnership are present, allowing the preparedness, expertise, and resources for your business to be proactive, greatly maximizing uptime and decreasing TCO.
The Intersection of Data Center Design Tiers & Service Layers
The various tiers of data center redundancy coupled with the layers of service create a spectrum of options to drive data center uptime. Here’s the matrix:
|
Design Tier |
|||||
|
TIER I |
TIER II |
TIER III |
TIER IV | ||
| Service Layer |
LAYER 1 |
L1 – T1 | L1 – T2 | L1 – T3 | L1 – T4 |
| LAYER 2 | L2 – T2 | L2 – T2 | L2 – T3 | L2 – T4 | |
| LAYER 3 | L3 – T1 | L3 – T2 | L3 – T3 | L3 – T4 | |
| LAYER 4 | L4 – T1 | L4 – T2 | L4 – T3 | L4 – T4 | |
With any decision-making process, there are always trade-offs to consider. A conceptual framework serves as a valuable tool for analysis, allowing each data center type, represented by the 16 cells above, to be assessed relative to each other.
The axis around which to assess should consider overall project and operational objectives. General areas to assess include:
- Availability – including reliabillity and restorability (MTBF & MTTR)
- Efficency – Power Usage Effectiveness (PUE)
- Total Cost of Ownership (TCO) – including Capital (CapEx) and Operating (OpEx)
- Deployment – related to speed and operations
Let’s dive into how the key frameworks of availability, efficiency, total cost, and deployment maximize uptime.
|
Relative Favorability of Attribute by Data Center Design Tier & Service Layer |
||||||||
|
MTBF |
MTTR |
PUE |
CapEx | OpEx | Deploy | Complex | ||
|
TIER I |
T1 – L1 | 1 | 1 | 7 | 10 | 10 | 10 | 10 |
| T1 – L2 | 2 | 2 | 8 | 10 | 8 | 10 | 9 | |
| T1 – L3 | 3 | 3 | 9 | 10 | 7 | 10 | 8 | |
| T1 – L4 | 4 | 4 | 10 | 10 | 6 | 10 | 7 | |
| TIER II | T2 – L1 | 3 | 3 | 6 | 7 | 7 | 7 | 8 |
| T2 – L2 | 4 | 4 | 7 | 7 | 6 | 7 | 7 | |
| T2 – L3 | 5 | 5 | 8 | 7 | 5 | 7 | 6 | |
| T2 – L4 | 6 | 6 | 9 | 7 | 4 | 7 | 5 | |
| TIER III | T3 – L1 | 5 | 5 | 5 | 5 | 6 | 4 | 6 |
| T3 – L2 | 6 | 6 | 6 | 5 | 5 | 4 | 5 | |
| T3 – L3 | 7 | 7 | 7 | 5 | 4 | 4 | 4 | |
| T3 – L4 | 8 | 8 | 8 | 5 | 3 | 4 | 3 | |
| TIER IV | T4 – L1 | 6 | 4 | 3 | 3 | 4 | 2 | 4 |
| T4 – L2 | 7 | 6 | 4 | 3 | 3 | 2 | 3 | |
| T4 – L3 | 9 | 8 | 5 | 3 | 2 | 2 | 2 | |
| T4 – L4 | 10 | 10 | 6 | 3 | 1 | 2 | 1 | |
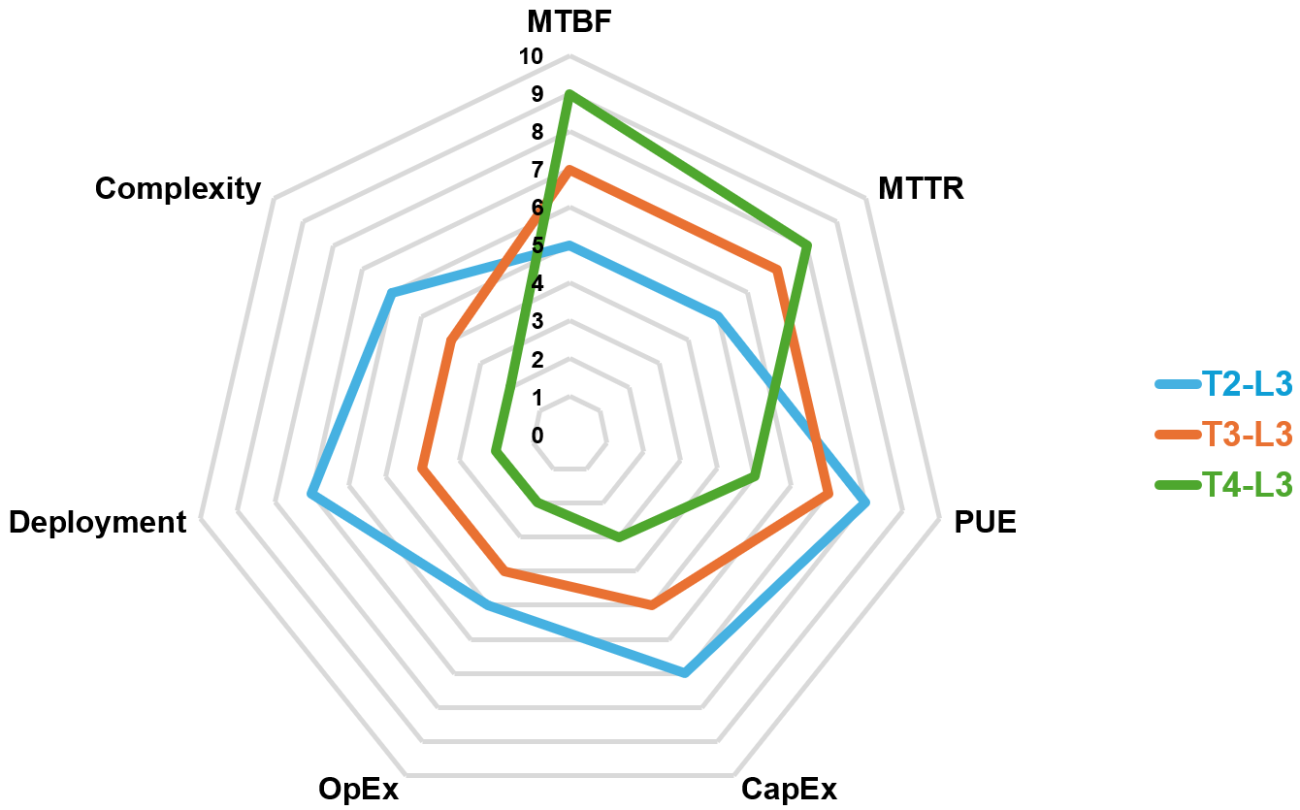
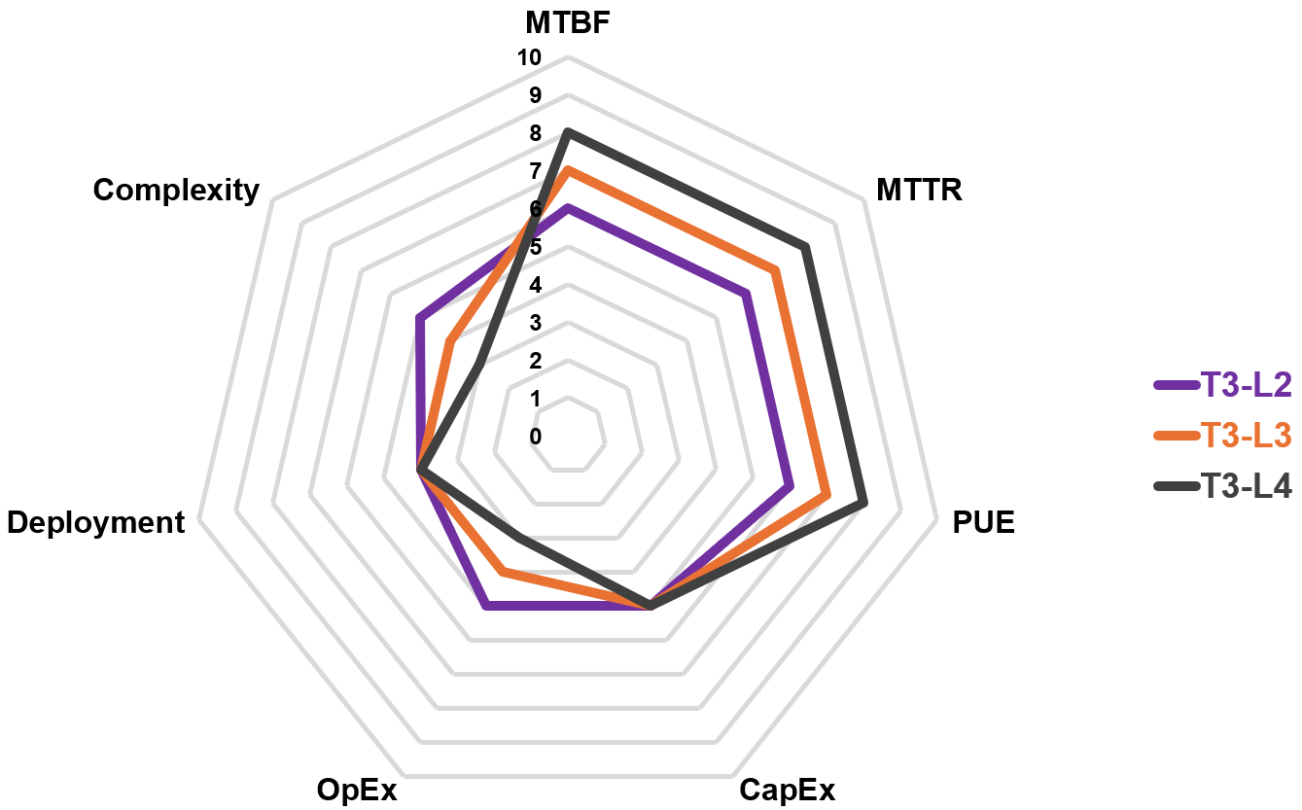
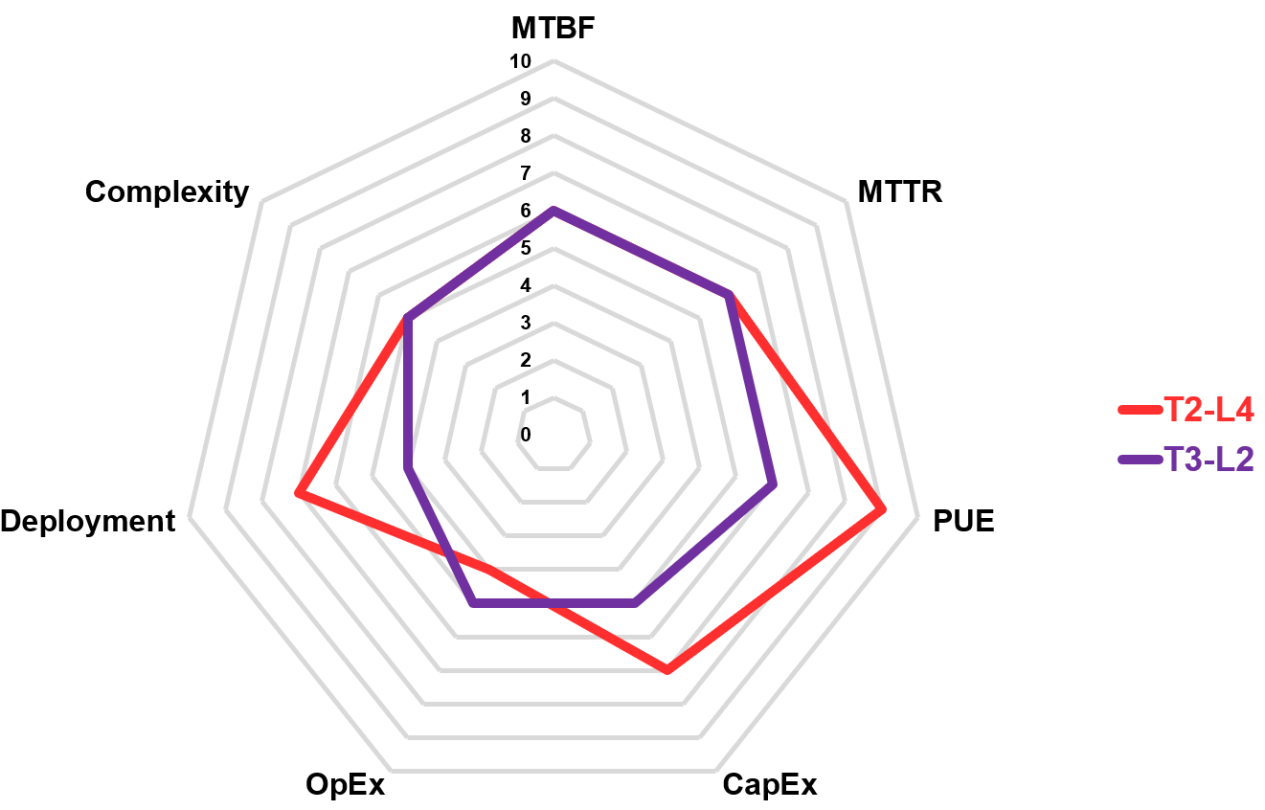
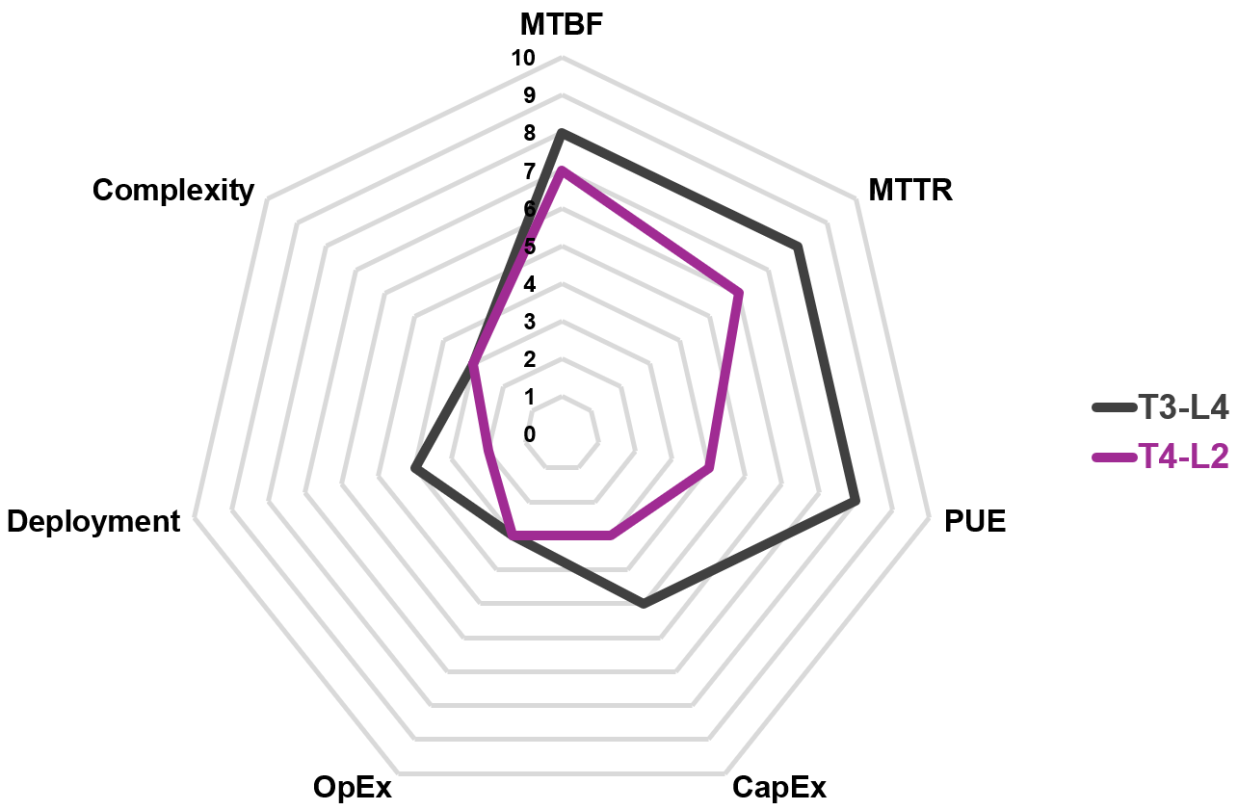
*These attributes and their respective scores serve as a conceptual framework and can/should be modified to best suit your business’ needs and goals.
Comparing Design and Service Level Tradeoffs
By employing a radar chart, it is possible to use this conceptual framework to visualize tradeoffs between various data center designs based on their relative favorability on the different attribute axis.
Now, let’s analyze a couple examples in the mid-range of the data center types. In the charts below, you can see how a data center type with a lower tier level and higher service layer can perform the same or better on almost all attributes.
Choosing the Right Data Center Service Layer
Selecting the right data center service layer is key to balancing uptime, efficiency, and cost.
This flexible framework allows you to compare the tradeoffs between data center design and service, showing how different priorities impact overall performance and uptime. Since every facility is unique, this concept should be adapted and tailored to meet the unique needs and goals of each facility.
We’re here to help you make the best service decision for your data center. Contact us with any questions or to further discuss reliable equipment and service.
Edited by Nicole Kristof, Senior Marketing Specialist
Stay up-to-date on industry trends & insights
Be the first notified of new blog posts
By submitting this contact form, you agree that a representative(s) of Mitsubishi Electric Power Products, Inc. (MEPPI) may contact you using the information you provided. In accordance with our Privacy Policy, we will never share or sell your personal data.

